AI in Supply Chain: How Machine Learning Is Reshaping Global Logistics in 2026
What the evidence shows about AI in supply chains, from McKinsey's early-adopter figures to UPS's ORION routing system, where AI adds value, why projects fail, and a step-by-step adoption path.
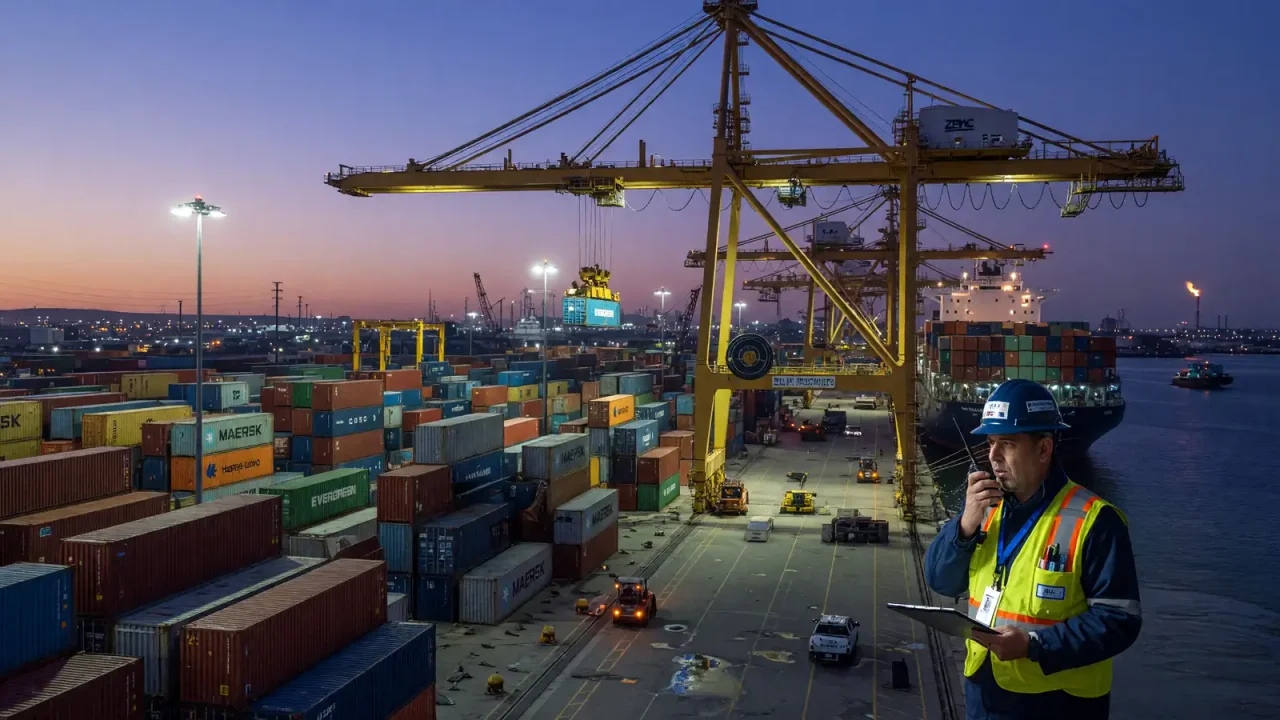
Supply chains went through a string of shocks in the early 2020s: pandemic closures, the Suez Canal blockage, semiconductor shortages, and shifting trade policy. Each one increased interest in using AI to forecast demand, plan inventory, and route shipments. Much of what is marketed as “AI in supply chain,” however, rests on well-established operations-research methods, now improved by better data and machine learning. Understanding that distinction helps companies invest in the parts that pay off.
This guide summarizes the strongest published evidence, explains where AI adds value, outlines common failure points, and sets out a practical path to adoption.
What the evidence shows
The most frequently cited estimate of AI’s impact on supply chains comes from McKinsey. In Succeeding in the AI supply-chain revolution, the firm reported that early adopters of AI-enabled supply-chain management improved logistics costs by 15%, inventory levels by 35%, and service levels by 65% compared with slower-moving competitors. The examples it describes include a mining company optimizing its mine-to-market chain, and a wheat trader planning harvesting and collection across 22,000 fields and more than 400 storage silos.
These figures compare leaders with laggards, so they reflect overall capability and management quality, not only the AI software. They are best used as an indication of what is possible, not as a forecast for a single project.
A concrete, long-running example of optimization in logistics is UPS’s ORION routing system. According to a 2020 UPS press release, ORION was first deployed in 2012, plans routes for more than 66,000 routes in the United States, Canada, and Europe, and has saved UPS about 100 million miles and 10 million gallons of fuel per year. UPS describes ORION as using advanced algorithms, AI, and machine learning, and the 2020 update added Dynamic Optimization, which recalculates routes during the day as traffic and pickup commitments change. ORION took about a decade of development before full deployment, which is a useful reminder of how long large-scale optimization projects can take.
Where AI adds value
Demand forecasting
Forecasting is where most companies start. Modern approaches add two things to traditional statistical methods:
- Probabilistic forecasts. Instead of a single number, the model predicts a range of likely outcomes, which leads to better safety-stock decisions. Open-source libraries such as Amazon’s GluonTS implement many of these methods.
- External signals. Weather, promotions, prices, and other data can improve forecasts for products sensitive to those factors, though they also add complexity and maintenance.
Forecast accuracy varies widely by product, level of aggregation, and time horizon, so claims of a specific accuracy percentage are only meaningful when those conditions are stated.
Inventory optimization
Classical methods (economic order quantities, reorder points, multi-echelon optimization) remain the core of inventory management. Machine learning mostly improves their inputs: demand forecasts and lead-time estimates. Better inputs allow lower safety stock at the same service level, which is where much of the inventory benefit in the McKinsey figures comes from.
Routing and transport
Vehicle routing is a long-studied operations-research problem. Tools such as Google’s open-source OR-Tools solve routing with real-world constraints like delivery time windows and vehicle capacity. ORION shows the scale of benefits when routing is optimized across a large fleet; for smaller fleets, off-the-shelf routing software can capture much of the same logic.
Warehouse operations
Robotics and computer vision are increasingly common in large fulfillment centers, for picking, sorting, and inventory counts. The business case depends heavily on volume: high-throughput facilities can justify the investment, while smaller warehouses often benefit more from better slotting and labor planning.
Exception management and documents
Some of the fastest returns come from less glamorous uses:
- Exception alerts that flag late shipments, unusual demand, or supplier risk early enough for planners to act
- Document processing to extract data from bills of lading, invoices, and customs forms
These uses are low-risk because a person still makes the final decision.
Scenario planning
Digital models of a supply network can simulate disruptions such as port closures or supplier failures. Their value depends on how accurately they reflect real lead times, capacities, and alternative sources.
Why better forecasts matter more upstream: the bullwhip effect
One reason AI forecasting can create outsized value is a pattern supply-chain researchers have studied for decades. In a 1997 MIT Sloan Management Review article, Hau Lee, V. Padmanabhan, and Seungjin Whang described the bullwhip effect: distorted demand information, passed from one end of a supply chain to the other, leads to excessive inventory investment, poor customer service, lost revenue, misguided capacity plans, and ineffective transportation. Their examples included Hewlett-Packard, where orders from resellers to the printer division fluctuated far more than actual sales, and orders from the printer division to its integrated-circuit division fluctuated even more.
The causes they identified are organizational as much as statistical: each stage forecasting from the orders it receives rather than from end-customer demand, batching orders, price promotions that pull demand forward, and rationing during shortages that leads buyers to inflate orders.
That has practical implications for AI projects:
- Share point-of-sale or consumption data upstream. A sophisticated model trained on distorted orders will still forecast distortion. The biggest gains often come from giving suppliers and planners access to real demand signals.
- Forecast at the level decisions are made. Store- and SKU-level forecasts help replenishment; aggregate forecasts help capacity planning. Use both, and reconcile them.
- Model promotions explicitly so planners can see how much demand is shifted rather than created.
- Watch ordering policies. Large batch sizes and rationing rules can undo forecast improvements; changing them may matter more than changing the model.
Using external signals in scenario planning
Disruptions such as port congestion, freight-rate spikes, and supplier shortages are hard to forecast from internal data alone. Public indicators can help planners calibrate scenarios. The Federal Reserve Bank of New York’s Global Supply Chain Pressure Index (GSCPI) combines transportation-cost measures and manufacturing survey indicators into a single gauge of global supply-chain stress. The New York Fed notes that, because some underlying data series were suspended, the index has been published with limited data since November 2025, which is a reminder to check the coverage of any external signal before relying on it.
External indicators work best as inputs to scenario planning rather than as direct forecast features: for example, defining “high pressure” and “normal” scenarios for lead times and freight costs and testing how inventory policies perform under each.
Why projects fail
| Failure point | What happens | Mitigation |
|---|---|---|
| Poor master data | Wrong lead times, units, or product hierarchies undermine every model | Clean and govern master data before modeling |
| Structural breaks | Models trained on stable periods fail during shocks | Keep scenario planning and human overrides |
| Bullwhip effect | Small demand changes amplify upstream | Share demand signals with suppliers |
| Black-box recommendations | Planners ignore outputs they cannot understand | Explain why the system recommends a change |
| Local optimization | One site improves while total cost rises | Measure end-to-end cost and service |
The 2020–2021 disruptions exposed the structural-break problem: models trained on years of stable demand could not anticipate sudden shifts. Human judgment and scenario planning remain essential.
A practical adoption path
- Set a baseline. Measure current forecast accuracy (for example, weighted mean absolute percentage error) and service levels for one product family.
- Test a probabilistic forecast. Check whether it improves service at the same inventory level, or reduces inventory at the same service level.
- Improve inventory parameters. Feed the better forecasts and lead-time estimates into reorder points and safety stock.
- Automate selectively. Only automate replenishment decisions once results are stable, and keep planners able to override.
- Expand to routing and exceptions. Apply optimization to transport and alerts once data foundations are reliable.
Throughout, track a small set of metrics: forecast error, inventory days, fill rate, and logistics cost per unit.
What to ask vendors
- What baseline did the reported improvement start from, and over what period?
- Was the improvement measured by the customer or by the vendor?
- How does the system handle sudden demand shifts?
- Can planners see why a recommendation was made?
- Which parts are machine learning, and which are conventional optimization?
Bottom line
The best evidence for AI in supply chains, from McKinsey’s comparison of early adopters to UPS’s ORION, shows meaningful gains in cost, inventory, and service. Those gains come from combining machine learning with proven optimization methods, clean data, and experienced planners, not from software alone. Companies that start with a measured baseline in one area, prove an improvement, and expand step by step are most likely to capture the benefits.
Sources
- McKinsey, “Succeeding in the AI supply-chain revolution”: https://www.mckinsey.com/industries/metals-and-mining/our-insights/succeeding-in-the-ai-supply-chain-revolution
- UPS press release via Nasdaq, “UPS to enhance ORION with continuous delivery route optimization” (2020): https://www.nasdaq.com/press-release/ups-to-enhance-orion-with-continuous-delivery-route-optimization-2020-01-29
- GluonTS (probabilistic time-series modeling): https://ts.gluon.ai/
- Google OR-Tools, vehicle routing: https://developers.google.com/optimization/routing